
On the links bellow you can find the previous articles on this topic. The first part – start your work with Google Data Studio, the second one is about styles and the third one is about the data source report overview.
Paid traffic report based on several data sources
The previous time I talked about a report in Google Data Studio based on one Google Analytics data, today I would like to pay your attention to some features when you work with several data sources.
Report template you can find on the link.
Business purpose of report
Client run advertising campaigns on Yandex Direct, Google Ads and Facebook ads. All links have utm-tags, data goes to Google Analytics, where you can find track leads.
To make life easier, on this template there is no calls, only a contact form sent, that we call leads. If you have several types of leads, I recommend to add an additional page with leads breakdown.
I want to show to a client data about impressions, clicks and cost from advertising platforms and leads statistic from Google Analytics. I will calculate conversion rate and CPL in total for a project and separate for each channel.
If you have an access to CRM system, you can go deep in your sales funnel and add data about sales from CRM.
Google Data Studio specific in work with several data sources
Google Data Studio allows to connect different data sources to one report and even draw one dashboard based on several ones.
To blend data from different data sources you should connect them to the report and then create a new blended data source. You can blend up to 5 different data sources in one new mix data source. All your base data sources should have the same field, on which base you will connect them. It could be a data, a campaign name, a user-ID or other.
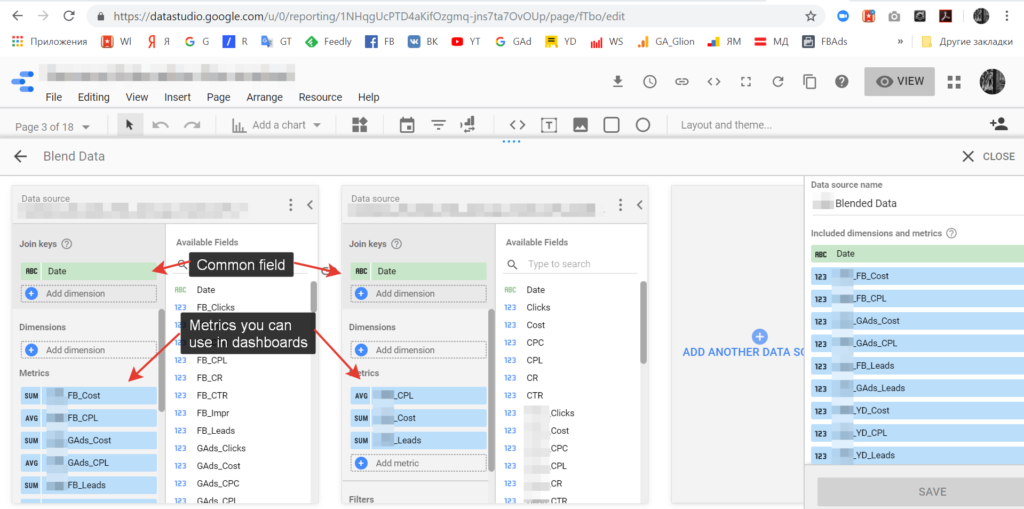
The name of the common field should be exactly the same to create a connection : name and data type as well.
After determining of common field you should choose metrics and dimensions that will be available on your new dashboards. You can change these settings later as well, if you forget something during the first setup. Sounds powerful and easy at the same time, isn’t it?
Calculated metrics
In my example cost import from advertising platform and quantity of leads from Google Analytics. To calculate CPL we should divide cost from one data source to leads from the second one. And here starts the most interesting part, because you can’t do any calculation with blended data.
Yes, you can create additional fields with calculated metrics but based only on one data source. If you have even Google Analytics and Google Ads, you can’t do any calculation on mixed data.
Calculated metrics on one data source look like this.
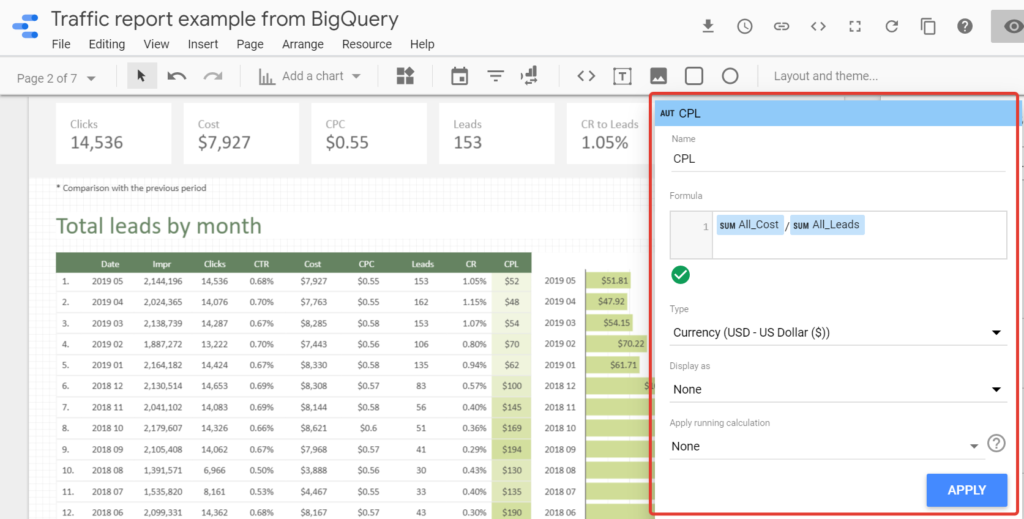
You create new field and write formula to count. If you use Google Analytics, then aggregation method will be setup automatically, for Google Sheets and BigQuery data you will set up an aggregation method manually for each field. For example, aggregation method for Cost will be Sum. Here you tell the system what to do with data in total row. If you have a setup aggregation method on data source, your formula could be:
CPL = Cost / Leads
If you didn’t set up an aggregation method you will write Sum in formula, like this:
CPL = Sum (Cost) / Sum (Leads)
Once again, you can create calculated metrics only for dashboards based not on one blended data source.
So, how can we count CPL?
By default, Google Data Studio offers free connectors with other Google services, such as Google Analytics, Google Ads, YouTube Analytics, Google Sheets and etc. To connect Yandex Direct or Facebook Ads you can use paid partners connectors or develop your own.
If you need a monthly based report you can put data manually to Excel or Google Sheets and connect spreadsheets to your Google Data Studio report.
I can see next option to count CPL or other metrics based on more than one data source.
- Manually download the data from advertising platform to Google Sheets. Change the data and do all calculations in Google Sheets and connect there sheets to Google Data Studio by default connector.
- The same way, but instead of Google Sheets you can connect Google BigQuery as a data source to Google Data Studio.
- You can use paid connector, as a SuperMetrics or others. But if you use a basic SuperMetrics connector (about $100 per month) you will not be able to create calculated metrics as well. As I’ve found a ready-made solution will cost from $500-600 per month.
- You can create your own connector or some additional script in BigQuery, that will upload data there automatically.
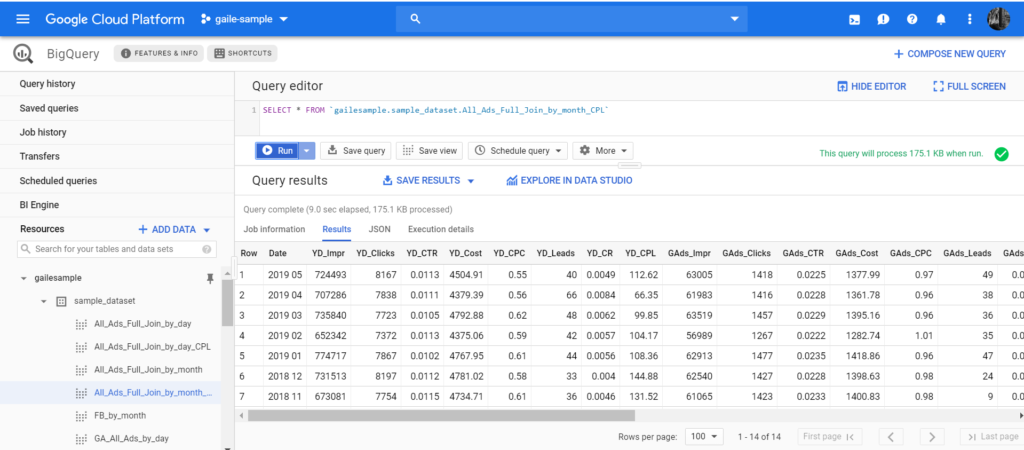
For my template I chose the second option: upload data to BigQuery manually. When all SQL scripts have already been written and dashboards have been drawn, it takes more or less than 30 min per report once per month.
When I was writing this article, I had already got some ideas about how to improve the system and make it more automated. I will add materials after realization and the first tests.
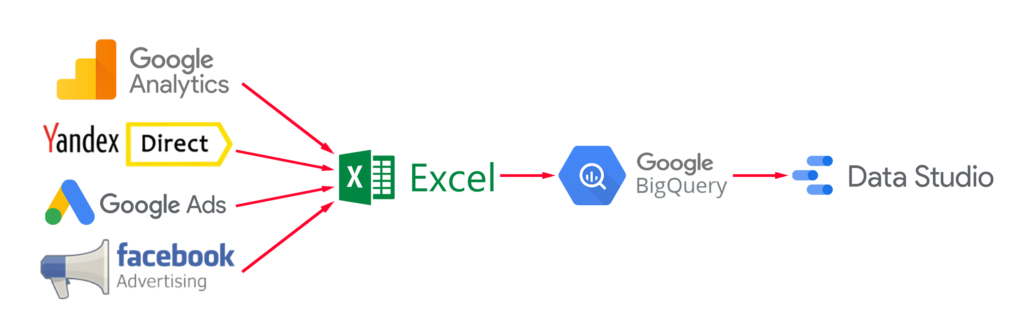
For now, schema looks like this.
What is the black box in BigQuery?
In Google BigQuery I unify sheets and group data by day and by month for each data source.
After that I select leads for each data source from Google Analytics by channel in separate sheet.
Combine data from advertising platform with Google Analytics and count calculated metrics, as CTR, CPC, Conversion Rate, CPL.
Blend data to one spreadsheet and choose this spreadsheet as a data source in Google Data Studio.
***
The beginning of the story you can read in my previous articles:
- How to start working with Google Data Studio
- Report styles
- Traffic report based on Google Analytics data only
In the next article I’ll describe blended data traffic report page by page.