
Google has a convenient free tool to prepare beautiful reports — Google Data Studio.
If you work with clients or you need to show data to your leadership, Google Data Studio reports can help you easily.
In this series of articles I’ll tell you about my experience with a tool and we will build advertising traffic report based on one data source — Google Analytics.
The report samples you can find on the link.
Advantages of Google Data Studio
- Free tool.
- Easy to start if you have already had an experience with Google products.
- Embedded integration with Google Analytics, Google Ads, Google BigQuery and others Google services.
- There are free connectors to data sources, but also you can buy partners connectors to upload data from Facebook Ads, LinkedIn or others.
- There is an opportunity to use an existed report as a template and connect to the data from another source, for example, another Google Analytics account. Thanks to that you can create fast similar reports for different clients.
- Easy to make beautiful and useful dashboards.
First steps in Google Data Studio
Visit Google Data Studio website and register there. After that you will landed to the main page.
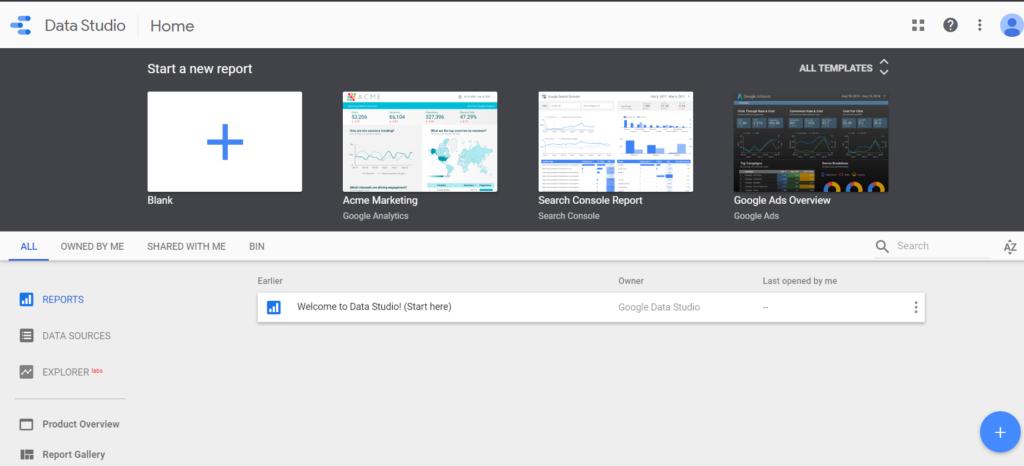
Google has already thought for us and created several reports templates that you can use. So I would like to offer to start from the blank to understand what is what in a platform.
Click to start a new report from the blank, accept terms, subscribe or not subscribe for email and here you are! The first page of your first report is opposite to you.
Add a data source
Let’s connect to data source on which base you will create your first dashboards.
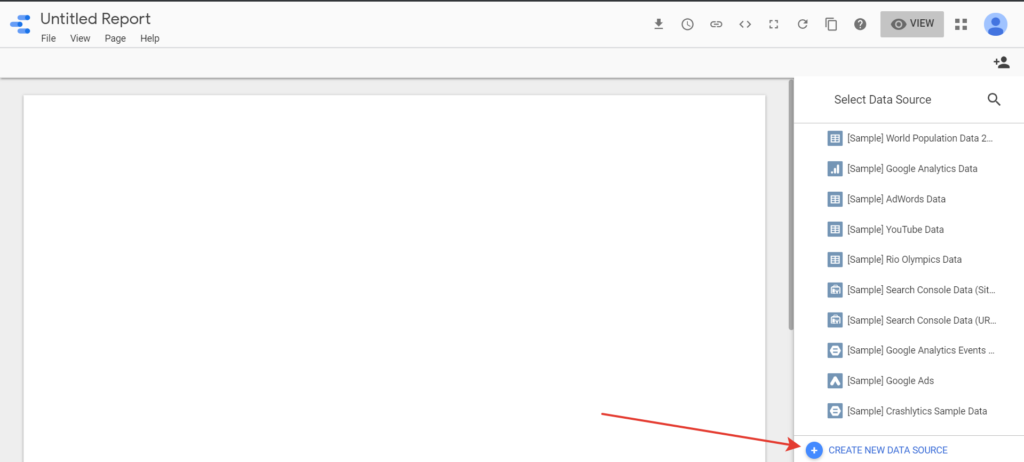
Click on the button «Create new data source» and on the next screen choose Google Analytics connector. In our case we will use this one. Before you click on Google Analytics just take a look which connector you have. As I said earlier, you can see free default and paid partner connectors.
To connect with Google Analytics account, you should have an access to it and login in Google.
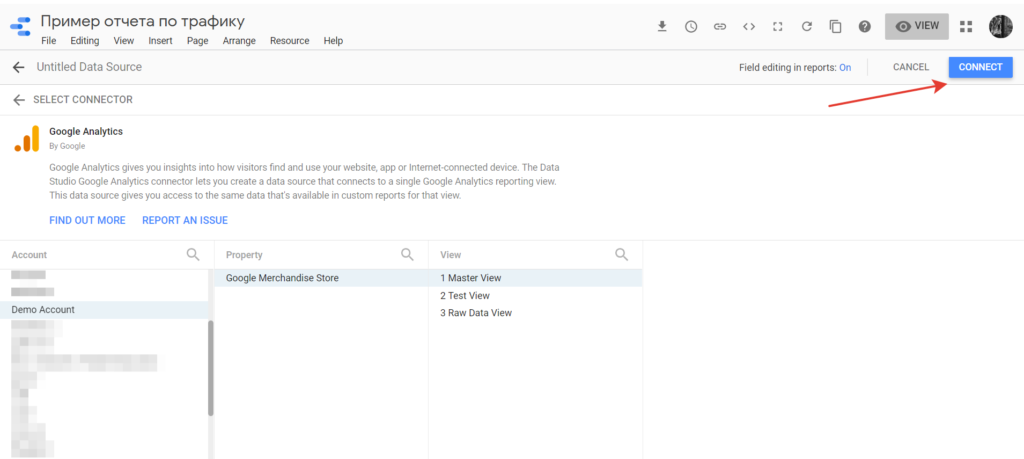
Please choose Account, Property, View and connect to the data source.
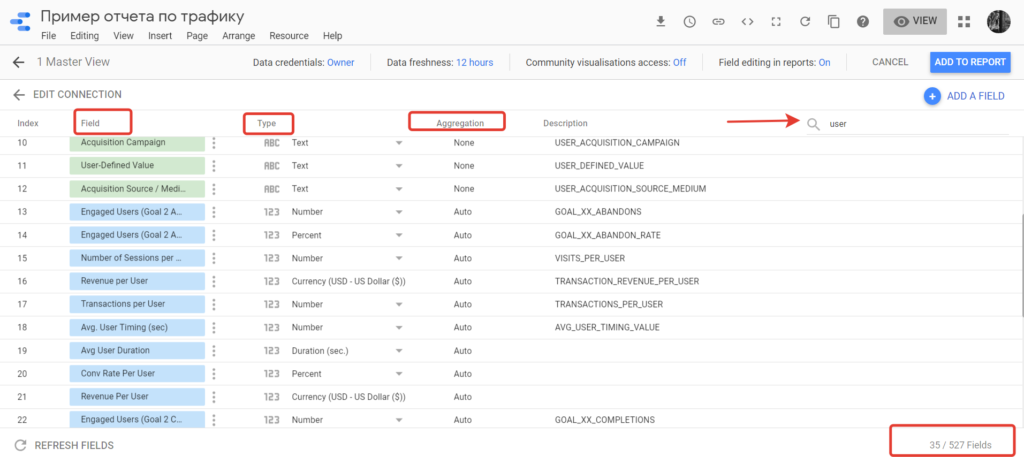
You will see spreadsheet with all data that you can use in your future dashboards. In my screenshot below you see that I can use 527 fields from Google Analytics.
In the screenshot just to give you an example, I typed «User» in a search field. Green rows — dimensions and blue rows — metrics. Green are text fields, blue are numbers, percent, finance metrics and etc. Logic is the same as in Google Analytics.
Here you can change field name or type if required. When you take data from Google Analytics you can’t change aggregation method, but if you have data from BigQuery or Google Spreadsheets, you can choose it. Aggregation means — how to work with data from different rows, for example sum or count average for a total row.
Check every point you need and connect to the data source.
Here I would like to go back for a while and explain you some setups that I do normally in Google Analytics. You can count this directly in Google Data Studio as well. But for me it’s more comfortable to do it in Google Analytics, because I use this tool to analyze advertising campaigns in GA.
Calculated metrics in Google Analytics
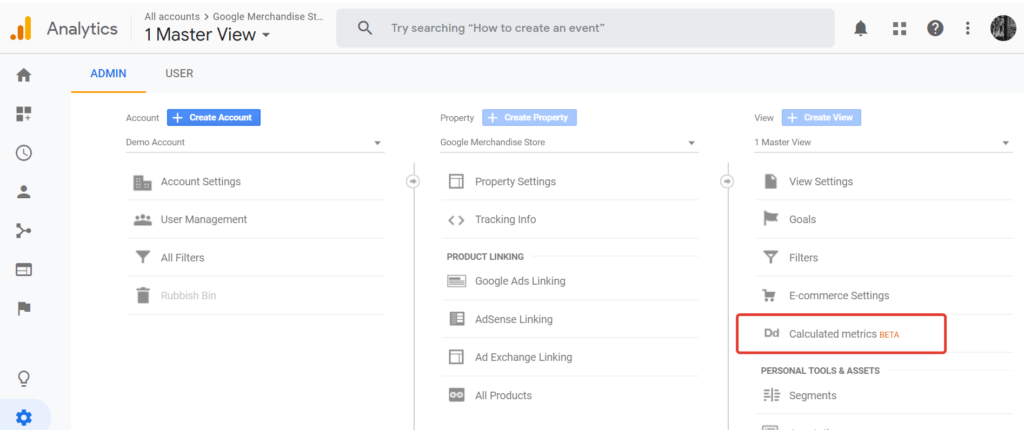
Go to your Google Analytics account admin page. In View level choose Calculated Metrics.
For this article and report sample I use data from Demo Google Analytics account and I can’t change Calculated Metrics there, but in your account you could do it.
Creating Calculated Metric please setup:
- Name — you can change it later, if you need
- External Name – unique Identifier using when querying via API and not allowed to change
- Formatting Type from the list
- Formula — how to count your new metric
I use calculated metrics to count total quantity of leads. For example, you have goal — Form sent, JivoSite dialog on a page and a phone call. With calculated metric you can sum all these leads in one column — Total leads. Also, I like to count conversion rates and CPL.
Total quantity of leads, CR and CPL you can load from Google Analytics or count directly in Google Data Studio.
***
When I started to write I didn’t expect that I have so much information and I decided to divide it for 5 articles.
In the context of next materials, we will take a look at 2 report samples and styles settings in Google Data Studio: